


5.
Debugging Java Projects
The CodeWarrior debugger lets you debug Java code as easily as C/C++ or Pascal code. This chapter assumes you are already familiar with the CodeWarrior debugger. If you need more information about the debugger, see the IDE User Guide. If you want a quick tutorial showing you how to use the debugger with Java, see "Programming Tutorial for Java." If you want step-by-step information on running a Java project under the debugger, see "Debugging a Java Project."
This chapter contains the following sections:
 NOTE:
NOTE:
To debug Java source on Windows, you must install Microsoft Internet Explorer or the Sun JDK. Both are included on your CodeWarrior CD.
Debugger Features and Limitations

The CodeWarrior Debugger contains many features that are specifically for debugging Java projects. It lets you:
The debugger has a few limitations:
Due to a limitation in the Sun 1.1.6 VM, Jar file debugging is not supported when using version 1.1.6 of Sun's VM. JDK 1.2 and later does support jar file debugging.
On Windows and Solaris, multi-language stepping is not supported. When debugging a Java program with native C methods in it, the debugger treats it as a Java program and it will not be able to step into any native code.
On the Macintosh, multi-language stepping is not fully supported. If you implement some native methods in C, you can open both the Java class files and the C SYM files for the native methods in the debugger at the same time. And if you set breakpoints in both the C and Java files, the debugger will automatically break at those statements. However, the stack crawl window does not show the call chain across languages and you cannot single step from C code to Java code or from Java code to C code.
The debugger cannot debug compressed Jar or compressed zip files. This includes Java applications that are in compressed Jar or compressed zip format.
When using the new Sun Java Debugger plugin, you will not be able to debug external stand-alone Java libraries. For instructions on how to debug Java code that does not originate within your Java project, see "Debugging External Java Sessions (Windows Only)".
Special Debugger Features for Java

This section explains some of the special CodeWarrior Debugger features for Java. It contains the following:
Breaking on Java Exceptions

The CodeWarrior debugger can automatically break when your class throws an exception. Just choose one of these options from the Control > Break on Java exceptions hierarchical menu.
Opening Multiple Class Files in One Browser

If you are debugging a project that creates multiple class files, you can view all the class files for a folder in one Browser window. Just turn on the Debug all class files in directory hierarchy option in the Global Settings IDE Preferences panel. When you open a class file, the Browser window displays the classes for that file as well as for all the files in the same folder and its subfolders. If this option is off, the Browser window displays the classes for one class file only.
Choosing a Java Applet Viewer for Debugging

When debugging a Java applet, the applet runs within an applet viewer or a Java-aware HTML browser like such as Internet Explorer. To learn how to specify the applet viewer, see "Applet."
 NOTE:
NOTE:
Although many applications can run an applet on Mac OS, you can only use Apple MRJ to run an applet under the Metrowerks debugger. This is because the debugger requires the application to support Metrowerks's Java debugging API, and this is the only Virtual Machine that does so at this time.
Debugging Threads

When you are debugging a Java program, the running process is either the specified applet viewer, or the Java interpreter.
You can view all the threads in a Java program in the Processes window. Choose Window > Show Processes and select the specified applet viewer, or the Java interpreter process in the left pane. The Java threads appears in the pane to the right.
Figure 5.1 The Processes Window
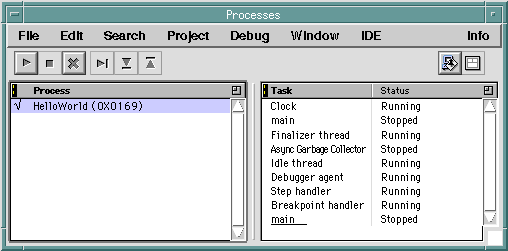
To display a debugger Program window for a thread, double-click it. To pause, continue, or kill a thread, select it and use the buttons in the Processes window.
 NOTE:
NOTE:
Many of the threads listed in the processes window are spawned by the applet viewer or interpreter running the Java program, or threads for the CodeWarrior Debugger. Pausing or killing one of them will have unforeseeable (and possibly quite unfortunate) consequences.
Viewing the Java VM Disassembly

You can view a listing of the Java Virtual Machine instructions that implement the class. Choose Assembler or Mixed from the Source pop-up menu at the bottom of any Browser or Program window (Figure 5.2).
The mixed view shows your Java source first, then the assembly language instructions that make up the Java code immediately after.
See also
"Disassembling Classes."
Figure 5.2 Viewing Java Assembly
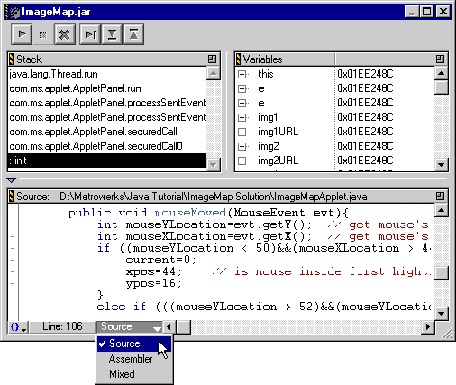
When viewing the assembly, you can still set breakpoints, step through code, and view variables. You can also view the assembly for a Java file in CodeWarrior by choosing Project > Disassemble.
Specifying Java Debugger Settings

There is one setting in Global Settings panel of the debugger group in the main IDE Preferences dialog that applies to Java: Debug all Java class files in directory hierarchy.
Figure 5.3 Global Settings Panel
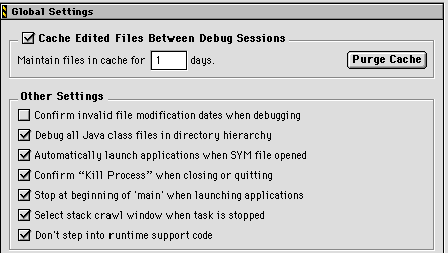
The Debug all class files in directory hierarchy option opens all the class files in the directory and all contained directories, and merges them all together in the same Browser window.
Debugging External Java Sessions (Windows Only)

This section discusses how to launch and debug a Java application that runs within a native Windows application.
In the text that follows, we make several references to a folder named VM Launcher Example on the CodeWarrior CD. It is in the following location.
CodeWarrior Examples/CodeWarrior Java/
About Sun VM Debugging
To better understand what is needed to debug an external Java session with CodeWarrior using the Sun Java VM, it is important that you know the following:
Because of these things, attaching to a running VM requires that the following be true:
1. The VM must be launched to be debuggable on a particular TCP/IP port.
2. The debugger must attach to the known TCP/IP port once the VM has been launched.
So, you can see that attaching to a running Java VM is not as seamless as attaching to a native Windows executable.
Registering TCP/IP Debugger Ports
The first thing you must do is configure CodeWarrior so that it will allow you to attach the Java debugger to a TCP/IP port. You must define one or more ports that CodeWarrior will use for debugging.
The way to define the port(s) is via the registry. The VM Launcher Example folder contains a file named DebugPorts.reg for this purpose. Examine the file in Notepad by right-clicking the file and choosing Edit from the resulting pop-up menu. The file should appear similar to Listing 5.1. Edit the port numbers to suit your needs. Then save and close the file.
Listing 5.1 DebugPorts.reg
REGEDIT4
[HKEY_LOCAL_MACHINE\SOFTWARE\Metrowerks\CodeWarrior\4.0\Java VMs]
"JDWP debug ports"="8000,8001,8002,8003"
"11XWP debug ports"="8004,8005,8006,8007"
JDK versions 1.1.x, 1.2, and 1.2.x support 11XWP debugging ports. Only JDK version 1.2.2 with JBug installed supports JDWP debugging ports. The value data must consist of one or more port numbers, separated by commas. For more information on debugging with JDWP, see the Sun Java Debugger plugin release notes.
To add the contents of DebugPorts.reg to the registry, simply double-click the file. Windows creates the appropriate key in the registry, and adds the values to it.
 WARNING!
TCP/IP port numbers are limited to the range of 0-65535. Ports below 8000 are reserved and should not be used. So, you can use any port above 8000, assuming no other application on your system is using that port, too.
Instructing the VM to Run in Debug Mode
The next step is to ensure that when the native application launches a VM session, it does so in debug mode. Modifying a native application itself to launch the VM in debug mode is not practical. Instead, we use environment variable _JAVA_OPTIONS, which is new in JDK 1.2. Options defined via this environment variable will be used any time a VM session is instantiated.
Because you may not want to always run Java sessions in debug mode (for performance and security reasons), you will usually want to specify the _JAVA_OPTIONS on a per session basis. The best way to do this is to use a command (.cmd) file.
The VM Launcher Example folder contains two example command files. One is to be used with a standard non-debug JDK 1.2; the other is for a JDK 1.2.2 installation that has the JBug binaries installed (and hence supports the new Sun debugger specification).
 NOTE:
NOTE:
The command files require a minor modification to work correctly. The path to JDK should be changed to the location of JDK on your particular system. Examine the command files for more information.
Instead of launching VMLaunch.exe directly, you will launch these command files. The command files will set the _JAVA_OPTIONS environment variable, and then launch VMLaunch.exe for you.
Initiating a Debug Session
To show you how to attach CodeWarrior's debugger to a VM that is embedded in a native application, we have provided a short tutorial in the VM Launcher Example folder. Follow the steps below.
1. Import DebugPorts.reg into your registry.
In the Windows Explorer, double-click the file named DebugPorts.reg. Windows creates a matching registry key.
2. Open the VMLaunch.mcp project.
3. Verify the path to your JDK.
Open VMLaunch.cpp. Make sure USE_1_2_JDK is defined, and that the LoadLibrary() call is pointing to your particular JDK installation, as only 1.2 VMs and later can be seemlessly attached to.
4. Build the project.
Choose Project > Make to build the project.
5. Verify the PATH environment variable in the command file.
Open the file named LaunchMe.cmd by right-clicking on it and choosing Edit from the resulting pop-up menu. Verify that the extension to the JDKPATH environment variable matches the location of JDK on your particular system. Close the file when you are done.
The LaunchMe_Jbug.cmd file is provided for attaching to a JBug/JDWP enabled VM. You may use this file in place of LaunchMe.cmd.
6. Launch the command file.
From Windows Explorer, launch LaunchMe.cmd. Ensure that the Java application runs without problems.
7. Open TrivialApplication.class
Select File > Open. The file selection dialog box is displayed. Change the Files of Type pop-up menu to Java Class Files. The dialog box displays the TrivialApplication.class file. Double-click TrivialApplication.class to open it. The browser window displays the class information for this class.
8. Open the Process Window.
Select Window > Process Window to open the Processes window.
9. Open the debugger port.
Double-click on "11XWP debug port 80004 (inactive)" in the list. The debugger attaches to the VM.
The CW Java Output Window displays the output of the Java application. Set a break point in TrivialApplication by selecting it in the browser window. The debugger takes control and lets you step through the program.
Java Settings Panel (Windows Only)

The Java Settings panel (Figure 5.4) controls how the debugger interacts with JView when debugging Java applets or applications.
Figure 5.4 The Debugger's Java Settings preferences panel

The items in this panel are:
Class for Debugging
This field specifies the particular class you wish to debug.
Program Arguments
This field specifies command-line arguments to be passed to your Java program when the debugger launches the program.
JView Arguments
This field specifies arguments to be passed to the jview interpreter by the debugger when it launches the Java application. Argument options are shown in Table 5.1.
Table 5.1 Jview argument options


Visit the Metrowerks website at: http://www.metrowerks.com
For assistance contact Metrowerks Technical Support at: support@metrowerks.com
Copyright © 1999, Metrowerks Corp. All rights reserved.
Last updated: May 24, 1999
 NOTE:
NOTE:


 NOTE:
NOTE:
 NOTE:
NOTE:

 NOTE:
NOTE:


 WARNING!
 NOTE:
NOTE:


